COVID-19 & Amazon: Shifts in Purchasing Behavior
March 2020: COVID-19 changes the shopping behavior of consumers. While local retailers are forced to close and many entrepreneurs are plagued by existential fears, customers are also insecure. Will everyday products still be available? Should larger purchases be avoided and money saved instead? Will online shops be able to meet the expected high demand?
In this blog article, we would like to answer the question as to whether customers have changed their search and buying behaviour on Amazon since the outbreak of SARS-CoV-2. To this end, we have analyzed how lockdowns have affected the most important key figures in advertising to help provide conclusions about how consumers have changed their behaviour in response to such policies. We have also compared the data with Apple's mobility trend. In this way, you can learn, amongst other things, how the COVID-19 pandemic is affecting the movement data of the population and the sales of Amazon merchants.
These findings are not only very interesting, but can be used to optimize your advertising on Amazon, an idea we will also explore and explain in this article.
You can also watch our video:
COVID-19 lockdown and online trading
An important point to note before getting started is that the data basis for all of the following statements on Amazon performance data is, unless otherwise stated, AMX500. AMX500 is an index which represents the average advertising performance data of 500 anonymized international Amazon merchants managed by BidX from Canada, France, Germany, Spain, Italy, UK and the USA, over various time periods. The mentioned data on sales, costs, etc. are always related to advertising (e.g. the sales generated by advertisements, etc.).
We provide access to AMX500 free of charge, but only via invitation link. You are more than welcome to send us an email at amx500@bidx.xyz to request access to this data.
Restrictions on public life caused by the coronavirus began in mid-March with various states instituting lockdown policies, which included contact restrictions, as well as border and store closures. Most national borders were shut and local shops forced to cease in-person trading.
For physical shops, this represented somewhat of a crisis. But, can e-commerce benefit from the shift in market share from off- to online? Or has the joy of consumption also waned due to coronavirus-related existential fears?
Taking a look at the published sales figures of Amazon, it seems the former trend prevails: In the first quarter of 2020, sales rose by 26% to 75.5 billion USD compared to the same period last year (Source: Amazon First Quarter 2020 Results).
Our simple hypothesis:
Consumers have satisfied their demand during the lockdown period by migrating to online shopping.
The average sales figures generated from advertising by 500 Amazon retailers during this period confirm this theory. Let's take a closer look at them for the period from 01.02.2020 to 31.05.2020.
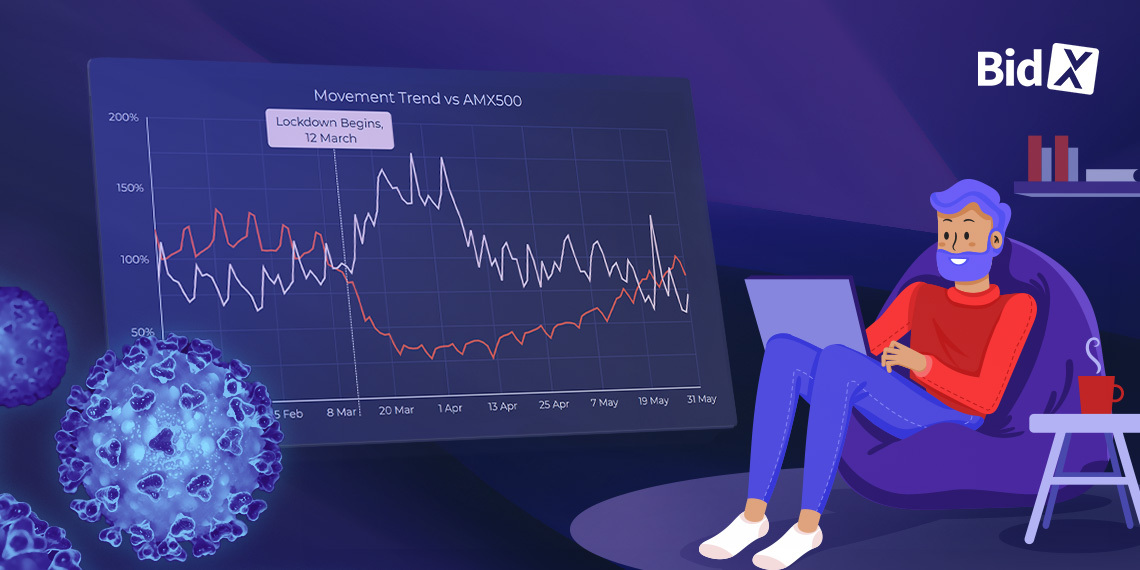
Course of the AMX500 during the coronavirus crisis
To understand the index value, the average daily value over the period of February to May 2020 represents 100% (i.e. the average rate of trading). Therefore, higher and lower values simply show any increase or decrease in the index on the corresponding date (i.e. a rate above or below average). The main findings from this chart can be summarized as follows:
- From mid-March onwards, the AMX500 shows a significant increase.
- 15 March marks the beginning of the increased sales period - on this day the index rose above 120% for the first time.
- One day later, on 16 March, the closure of the stationary retail trade in Germany was announced for 18 March.
- In addition, in the other constituent countries of the AMX500, stores were also closed in mid-March.
- Italy kicked off on 12 March (marked with "Lockdown Begins" in the chart) - the other countries followed suit with successive store closures over the following 1.5 weeks.
- Since 15 March, a steady increase in sales was evident.
- The peak was reached on 29 March. On this date, the index stood at 178%, i.e. advertising revenues almost doubled compared to the average value. It should be noted that 29 March was a Sunday. That this is the day with the highest sales of the week can be seen on the many small "peaks" in February as well as on the following Sunday, which also had a high value at 175%.
- From 05 April, sales again approached the average level for February, despite most shops not being allowed to open without restrictions until 06 May in Germany.
- These high sales figures, especially at the beginning of lockdown, may indicate that consumers, perhaps out of nervousness and due to uncertainty, wanted to stock up on various products as early as possible for their time at home. Indeed, this hypothesis is confirmed by looking at corresponding search queries and search frequency ranks from Brand Analytics.
Amazon Brand Analytics confirms interest in certain products
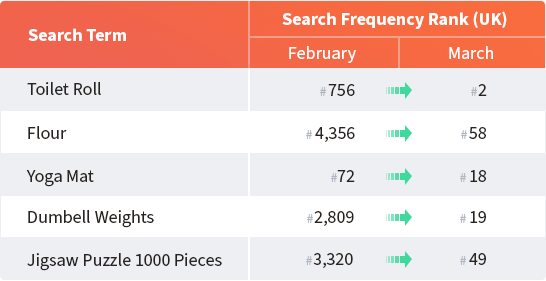
We have analyzed the Amazon keywords for March to see if products of a certain category were actually in demand more frequently in this month than in February. The results are extremely interesting! We have summarized the most important findings below. The data refers to the UK Amazon marketplace.
With Brand Analytics, sellers and vendors can see the frequency of specific Amazon search queries. Absolute numbers are not visible, but by ranking the search terms, sellers can get relative information about which search terms are being entered more often than others. Continue reading to learn more about how Brand Analytics can help advertisers.
- By February, “surgical mask” was already the most searched for product.
- In March, the top 3 search terms on Amazon were "hand sanitiser gel", "toilet roll" and "face masks".
- Throughout March, the greatest demand for products was in the entertainment, leisure and hygiene sectors, proven by search terms centering around fitness, puzzles and disinfectant
- Durable food such as pasta, rice and flour were also increasingly sought on Amazon in March.
The following table compares selected search terms and their search frequency rank in February and March respectively. This figure shows very clearly the increased demand for hygiene and entertainment products in March.
The percentage increase in paid orders shows that people also bought these products more frequently, and not simply that they just paid more for them. In the period from 01.03.2020 to 15.04.2020, for example, the number of paid orders increased by 6.1% when compared to the previous 1.5 months, with total sales up 25.8%.
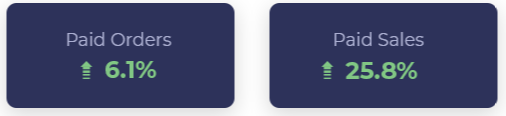
It is therefore obvious that the average shopping basket value also increased during this period, specifically by 18.6% compared to the previous period.
The following chart shows very clearly the change in the average shopping basket value in UK during lockdown.
More sales on Amazon amid a decreasing movement trend
Apple's published movement trends show that people have indeed severely restricted their travel and rate of relocation during lockdown, as reflected by reduced requests for directions on Apple maps.
We have compared the Amazon Market Index shown above with these movement trends. In order to provide better comparability, we have presented the average values of the movement data for the seven constituent countries of the Amazon Market Index.
Even at first glance, correlations between the two curves are apparent.
- Almost simultaneous with the start of a decreasing movement trend, the Amazon market index rose.
- This happened at the beginning of lockdown, entered into on March 12.
- While the average turnover of Amazon traders was already approaching its average level by mid- to late-April, there were still fewer requests for directions,and thus changes of location, in this period when compared with the period prior to lockdown, continuing up until the end of May.
- Having checked the correlation, i.e. the strength of the statistical relationship between the transaction data and the Amazon market index, we found a strong negative correlation (correlation coefficient ≈ -0.70), i.e. the less people moved, the more they bought on Amazon.
It is important to note that despite the correlation between the movement trend and the Amazon market index, a complete causal relationship cannot be assumed. This means that it is not known whether the decreasing movement numbers and increased time at home are the direct cause of the increased trader turnover. A third factor could likely explain both, for example, namely the closure of shops and the ban on contact. This is since decreasing movement is also a consequence of these measures, and therefore decreasing movement is not in itself the sole cause of the increased index value.
Further peculiarities in consumer behavior on Amazon
Besides an increase in purchasing rates on Amazon, there is another interesting change in consumer behavior, which can also be inferred from changes in the advertising figures of retailers during the lockdown period.
This is that, during the lockdown, consumers spent more time browsing and researching products.
How did we reach this conclusion?
This has something to do with the change in the click-through rate (CTR) and the conversion rate (CR) in the period from 01.03.2020 to 01.05.2020. In these two months, the CTR rose by a whole 33.8% compared to the previous period. The increase is clearly visible in the following chart. From March 19 onwards the upward trend began, and continued until the end of April.
But what actually took place in practice? Since CTR describes the ratio of clicks to impressions, the increase means that advertisements within the search results were clicked on more often. We suspect that consumers spent more time at home due to the lockdown and therefore simply spent more time on product research and comparisons. The result of more product comparisons is more clicks.
This assumption is supported by the change in the conversion rate, which fell by 15.1% over the same period (despite higher sales). The fall in the conversion rate began somewhat earlier than the rise in the CTR, as the following chart shows.
Since a lower CR means that fewer products were bought after clicks on advertisements than in the previous period, the above assumption is confirmed. When consumers want to inform themselves and compare products, they will click on several product detail pages, but will not buy from all of them - this quickly reduces the average conversion rate.
A look at the change in number of clicks also confirms this, as they increased by 20.2% over the same period when compared to the previous period.
Despite increased advertising costs due to the higher number of clicks, Amazon merchants were more profitable on average during the period from 01.03.2020 to 15.04.2020 than in the previous period. Such an insight is revealed by a look at the ACoS in the following chart. Compared to the previous period, the ACoS fell by 15.2%, mainly due to higher sales (+25.8%).
Key takeaways and conclusion
Since you probably have a lot of numbers buzzing around in your head, we have summarized the most important facts and conclusions for you here.
Since lockdown, more purchases have been made through Amazon, evidenced by both an increase in the number of individual orders, as well as in the average value of consumer shopping carts. A look at Brand Analytics shows that this increase may have something to do with an increased demand for hygiene products as well as products for leisure activities at home. It is obvious that consumers wanted to make their time at home as pleasant as possible due to contact restrictions and therefore looked for products which could be used during new-found leisure time, such as board games and fitness products. After most physical shops had to close in mid-March, online shopping was the only way to purchase such products.
Apple's movement trend also suggests that the population spent more time in their own four walls. Due to time gains, e.g. due to the elimination of needing to travel to a company office, more product comparisons were probably made on Amazon, one indicator for this being increased click numbers alongside a simultaneous decrease in the conversion rate.
What does this mean for you as an Amazon retailer?
The question you are probably asking yourself is what possibilities does this data actually present to you as an Amazon vendor?
It is important to recognize these trends, and to do so as early as possible. Therefore, we recommend regularly comparing your own sales figures with the data from AMX500, especially when new external influences arise or business contexts change. You should also take a regular look at Brand Analytics and analyze any changes in search queries evident during certain periods in the past. In this way, you can draw conclusions for future external influences of a similar character at an early stage and act accordingly.
The coronavirus crisis has shown that out-of-stock inventory has been a major problem for Amazon sellers. In case of special circumstances (including for events such as the upcoming Prime Day etc.), make sure that you build up a sufficient inventory early enough so that you do not run the risk of being unable to meet demand, thereby putting your business in the best position to benefit from commercial opportunities.
If an increased demand for a certain category of product which you sell is imminent, increase your advertising budget at an early stage in order to be one step ahead of sleeping competitors and visible to those consumers submitting a greater number of relevant search queries. In addition, you will most likely still benefit from "normal" click prices in the initial phase.
By the way, with our Boost feature, you can increase your advertising budget and bids for a certain period of your choosing with one click, later reducing them to their normal level again.
And last but not least, we have a simple but very effective management tip: Add special Amazon events (Prime Day, Cyber Monday, ...) and relevant external events, months and seasons etc. important for your business to your calendar so that you don't miss anything! We have got to know some sellers whereby lapses in keeping track of important dates has led to missed opportunities.
If you use Brand Analytics to identify special weeks and months where a product is most frequently searched for, then you can also place reminders in your calendar to increase advertising for this product with the appropriate lead time.
All this may sound very simple, but note that it can take some time when you have a large variety of products and require detailed brand analytics research. That said, in most cases it is more than worth the effort!
If you would like to use AMX500 to gain insight into the available data, please do send us an email at amx500@bidx.xyz and we will gladly send you an invitation link.
.jpg)

.jpg)

